Understanding the Results
After running a query, you can interact with the data in numerous ways. First, start with the map view and summary page.
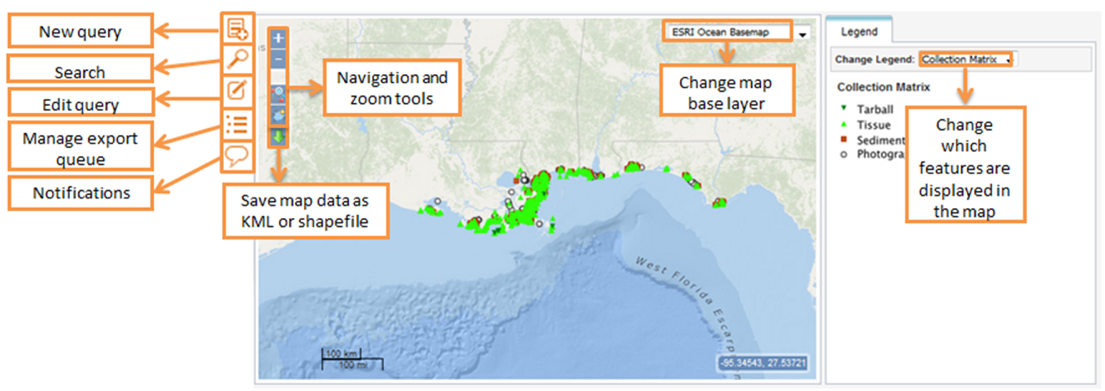
DIVER Explorer Results with Menu, Map, and Summary

- Menu Bar and Map of Results
- Use the Menu Bar to make a new query, search, edit query, manage the export queue, or see notifications.
- Use the Map View to examine spatial results.
- Navigation and Zoom tools change the spatial extent of the map.
- Map Data can be saved in a variety of file types.
- Map Base Layer can be toggled between world map, ocean basemap, world topographic, and national geographic ESRI base layers.
- The Legend tab changes how the result types are displayed in the map.
- Summary, Data and Export, Charts, Metadata, and Study Notes
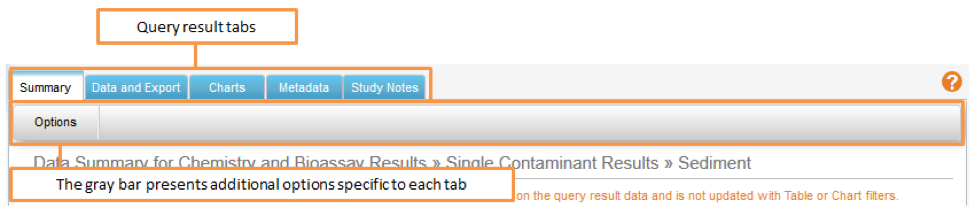
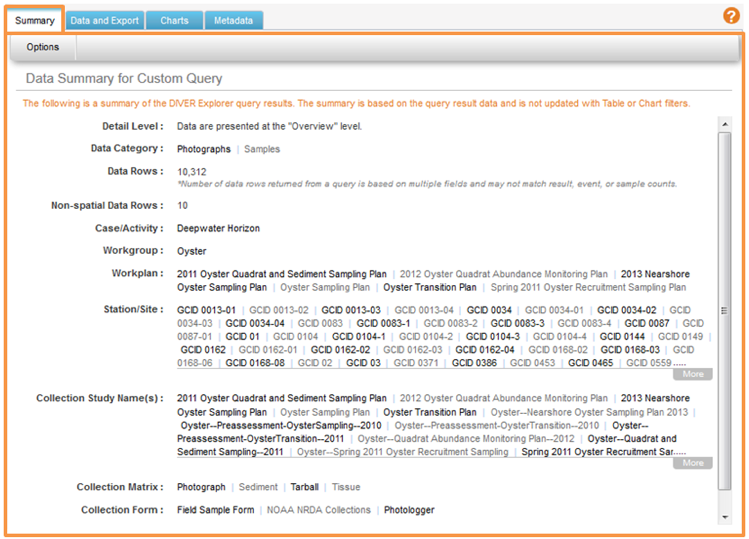
- Summary: Provides an overview of the DIVER Explorer query results. Information in the Summary tab can be used to double-check that the anticipated results were returned.
- Environmental Data Example
- Environmental Data Example
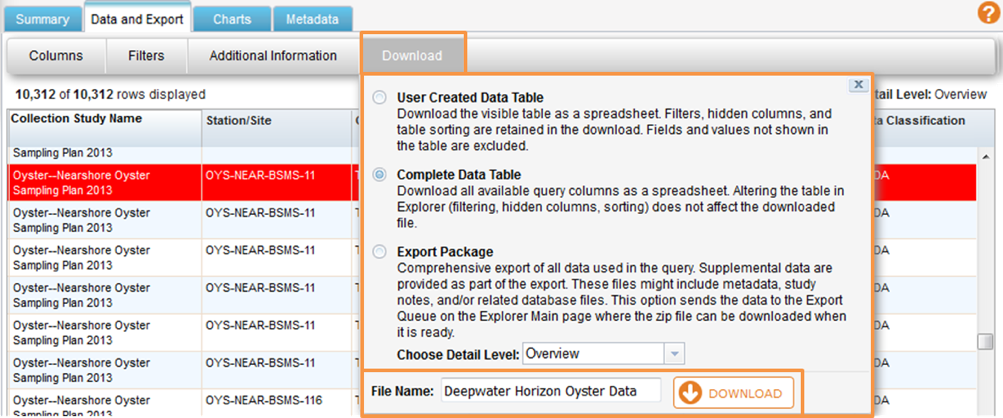
- Data and Export: Displays results in a table format and supports downloading.
- Columns can be added or removed.
- Filters can be applied to the results.
- Additional information, such as sample or trip data, can be found by clicking on an individual record and selecting "Additional Information" in the gray menu bar.
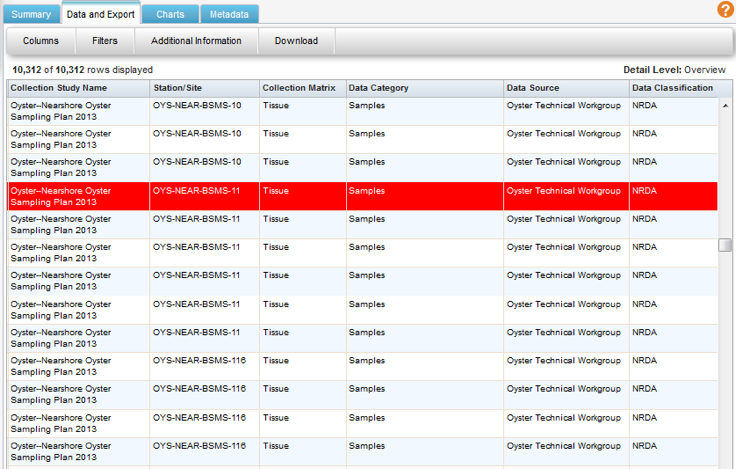
- To download, choose "User Created Data Table," "Complete Data Table," or "Export Package." Enter a File Name, and Download.
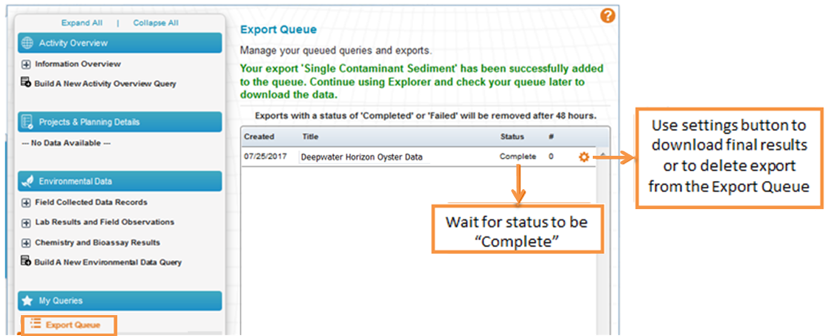
- Depending on the browser used the Export Queue may appear and display the status of the newly created export. Once the status reads "Complete", click the Settings button to download the results. If the Export Queue does not appear automatically, select the manage export queue icon in the menu.
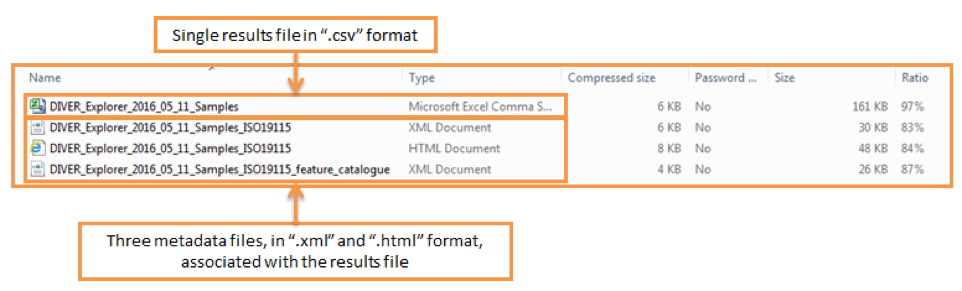
- The resulting download is a zip file containing a results file and three metadata files for each data category included. Below is an example of a Samples ".csv" results file and it's associated metadata files exported as a zip file.
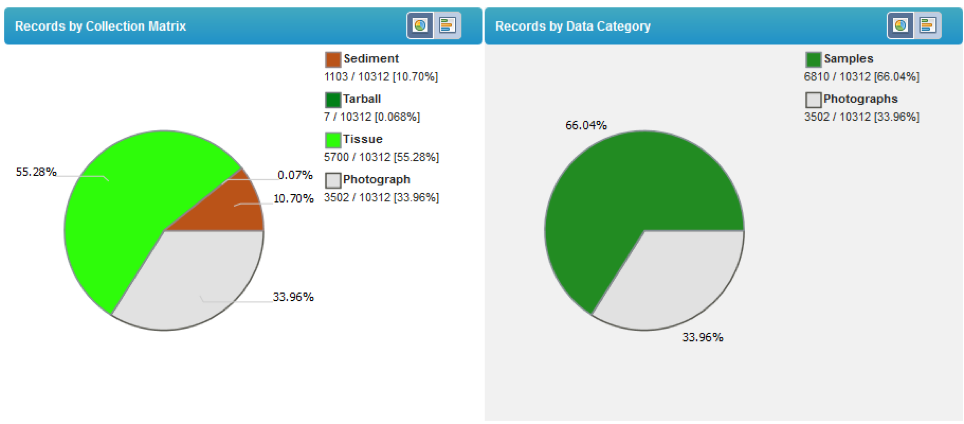
- Charts: Pie or bar charts are displayed for result visualization by several attributes. Clicking on a chart creates a new table specific to that portion of the chart.
- Metadata: Includes fields such as query details, data details, data caveats, and field definitions. They can be downloaded in .xml or .html formats.
- Summary: Provides an overview of the DIVER Explorer query results. Information in the Summary tab can be used to double-check that the anticipated results were returned.


